Engine Wash Analytics
An enterprise software providing customers with a reliable, single source of truth for their engine wash data and analytics.
Overview
Engine Wash Analytics gives a high-level overview of a particular fleet's wash performance — wash frequency and EGT recovery effectiveness. Help buttons and tooltips assist in interpreting the displayed information, with visual color scoring drawing attention to metrics that are quantitatively assessed relative to expectations.
EWA was a core project under "SAMA," a design team where I played an active part as an interaction designer. The product surfaces metrics on recent and historical wash performance results: wash frequency, equipment, adherence to wash execution recommendations, engine operational environment, and more — all of which have varying impacts on overall engine performance and durability. The screens were simplified to make wash frequencies and engine dynamics easy to understand at a glance.
UX process
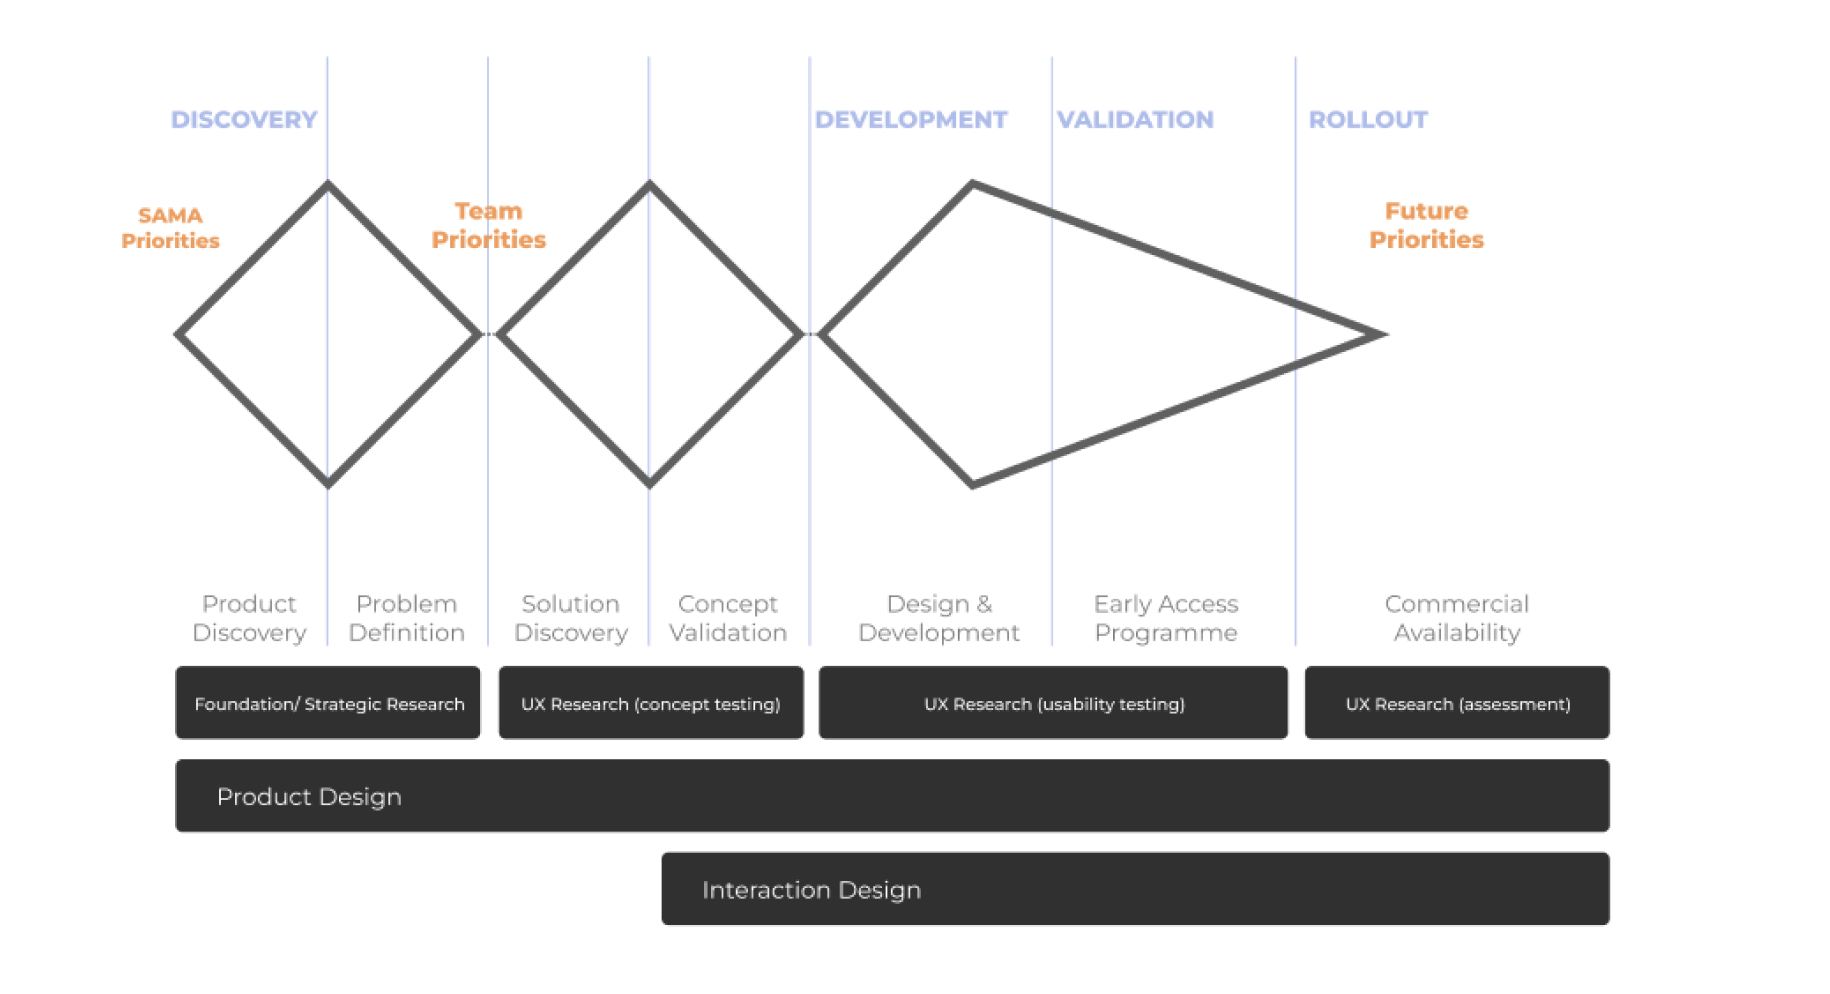
UX approach & vision
I led the interaction design with a milestone-driven approach focused on user testing and KPIs.
- Automate — automate the Engine Wash Analytics model end-to-end.
- One-stop architecture — bring all wash performance data into a single source of truth.
- Milestone-driven — every release was validated against user testing and KPI targets.
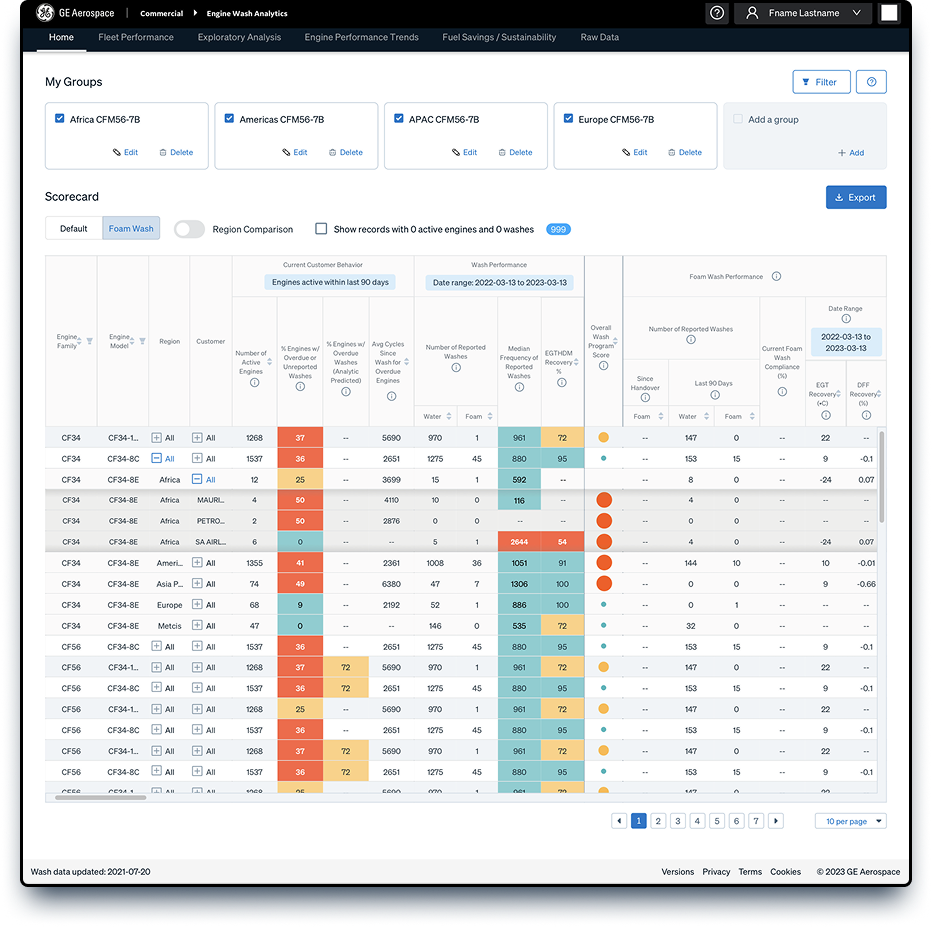
Home page
The home page gives a high-level overview of a particular fleet's wash performance (wash frequency and EGT recovery effectiveness). Users ensure the desired filters are in place via the Groups and / or Filters options. Help buttons and tooltips assist in interpreting the displayed information, with visual color scoring drawing attention to metrics that are quantitatively assessed relative to expectations.
The Fleet Performance page is a good next place to navigate — it provides additional wash performance KPIs, tables, and plots, including deeper insights into individual engines' current status and historical wash performance. More experienced users can navigate to the other pages of the tool for even deeper dives into individual wash event data, or individual engine performance trends as needed.
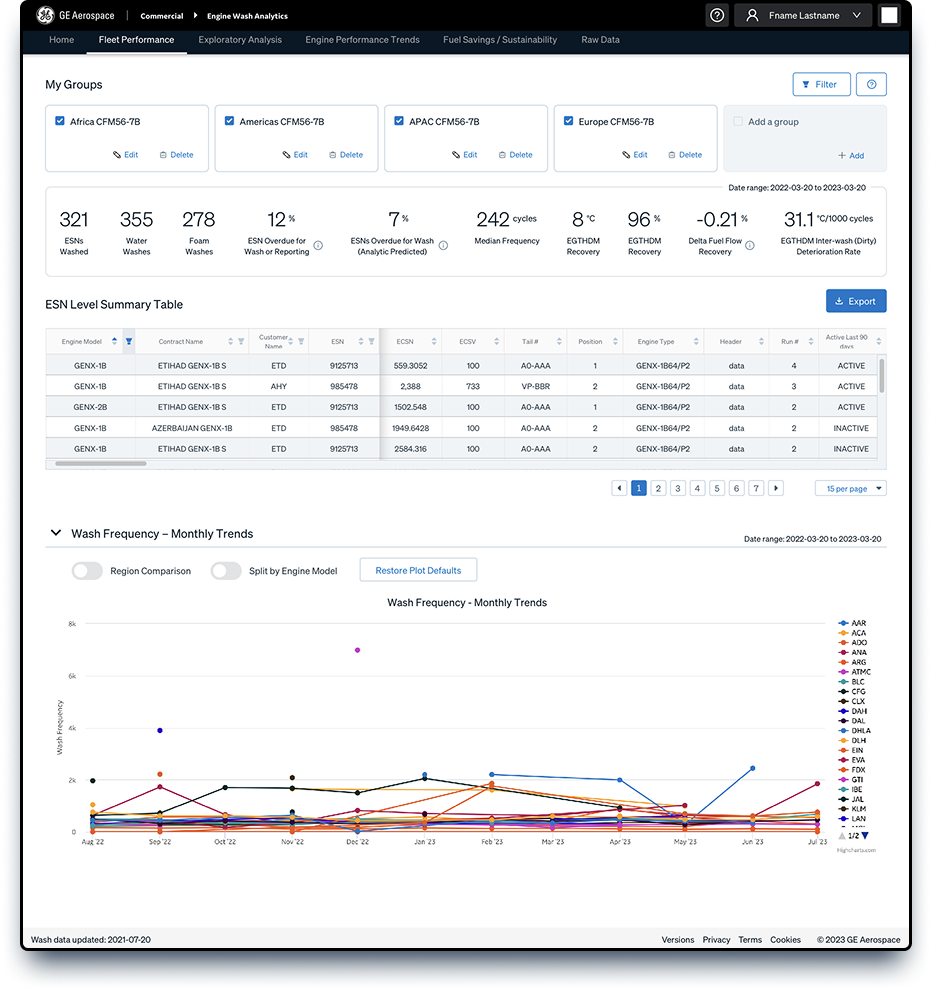
Fleet performance page
The Fleet Performance page provides an in-depth look at wash metrics and status for a single group of engines at the customer, engine model, and individual ESN levels. Only one "Group" is selectable at a time from the top row of tiles. Filters may be used to expand or reduce the included engine wash events.
- Key Performance Indicator summary — the top of the page displays a high-level tabulation of useful statistics for the filtered data. The default range is set to the previous 12 months.
- ESN-level summary table — each row represents the current state of an individual ESN within the group or filtered data set, covering engine cycles, operation state, target intervals, wash status, and EGTHDM.
- Wash frequency – monthly trends plot — a line chart showing wash interval frequency for reported washes within the group or filtered data set. Data is averaged per month and plotted over time.
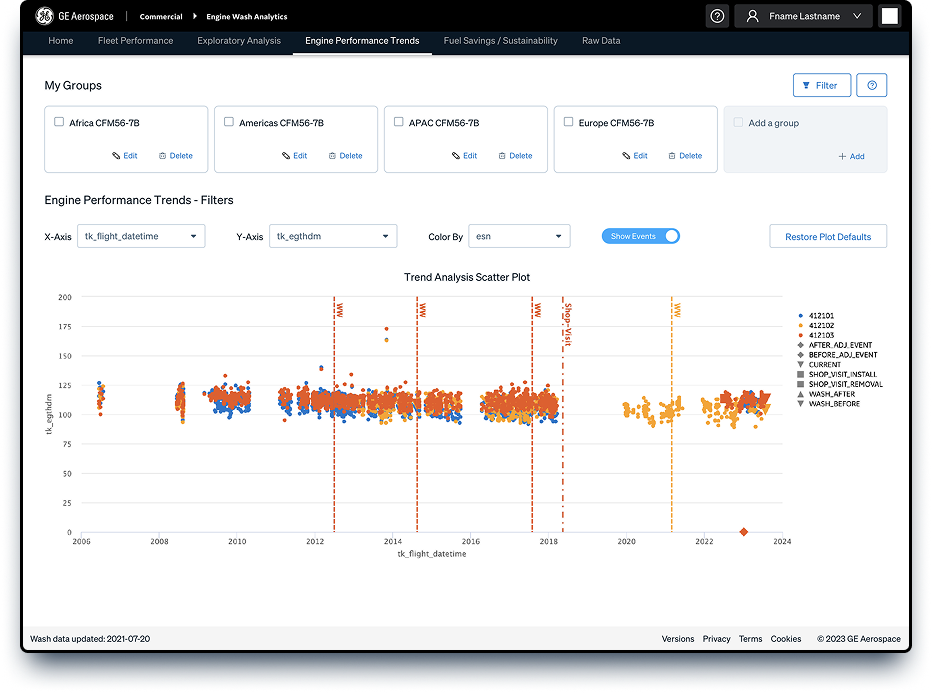
Engine performance trends page
The Engine Performance Trends page lets users view the raw, on-wing snapshot flight records for selected performance parameters versus time or engine cycles. The data is used to calculate the performance metrics relative to wash events used within the EWA tool.
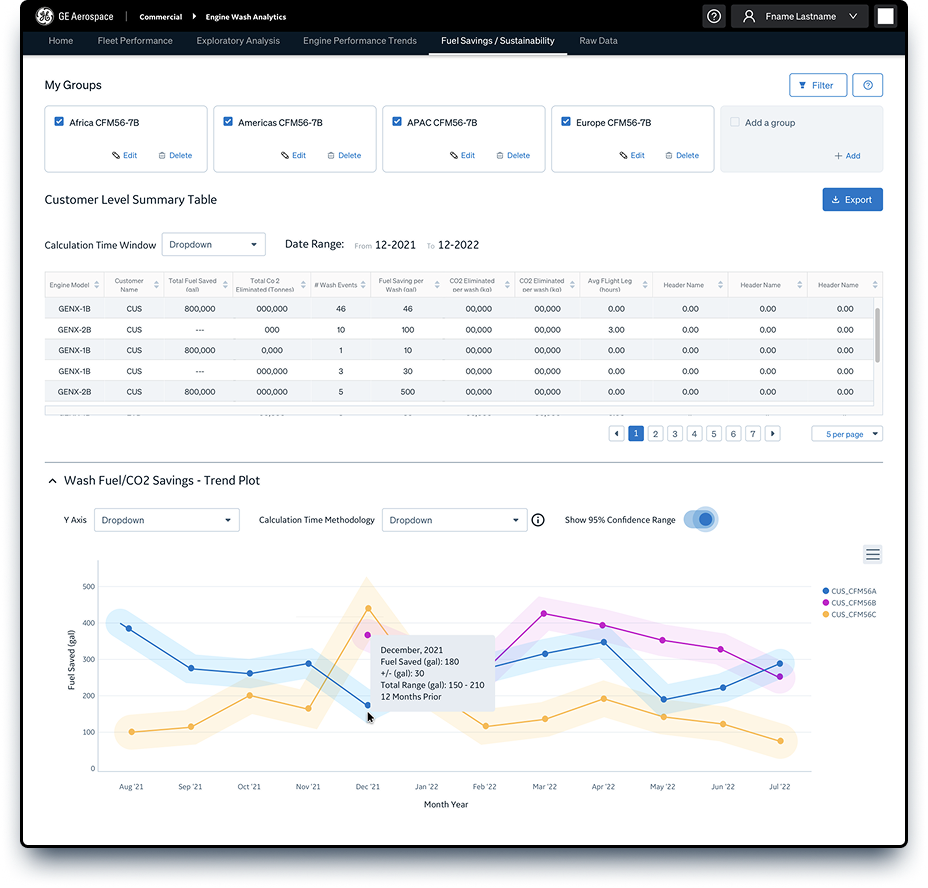
Fuel savings & sustainability
The Fuel Savings / Sustainability page provides estimates of fuel saved and CO₂ eliminated for a customer's wash program, relative to a "no-wash" equivalent scenario. The analytic uses the customer's historical wash intervals and engine performance statistics, along with customer-specific operational assumptions, to estimate these savings over a specific time interval on an average basis.
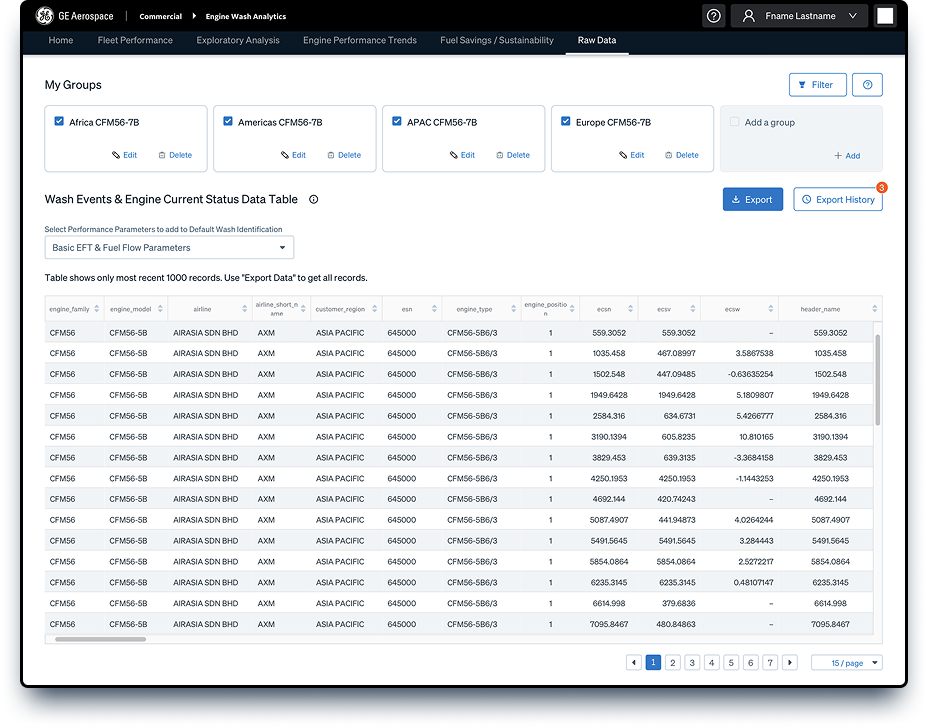
Raw data page
The Raw Data page provides a table where each row represents either an individual wash event or the current state of an ESN for the filtered data of interest. Data can be exported to a CSV file, and displayed parameter columns can be modified via the parameter selection dropdown.
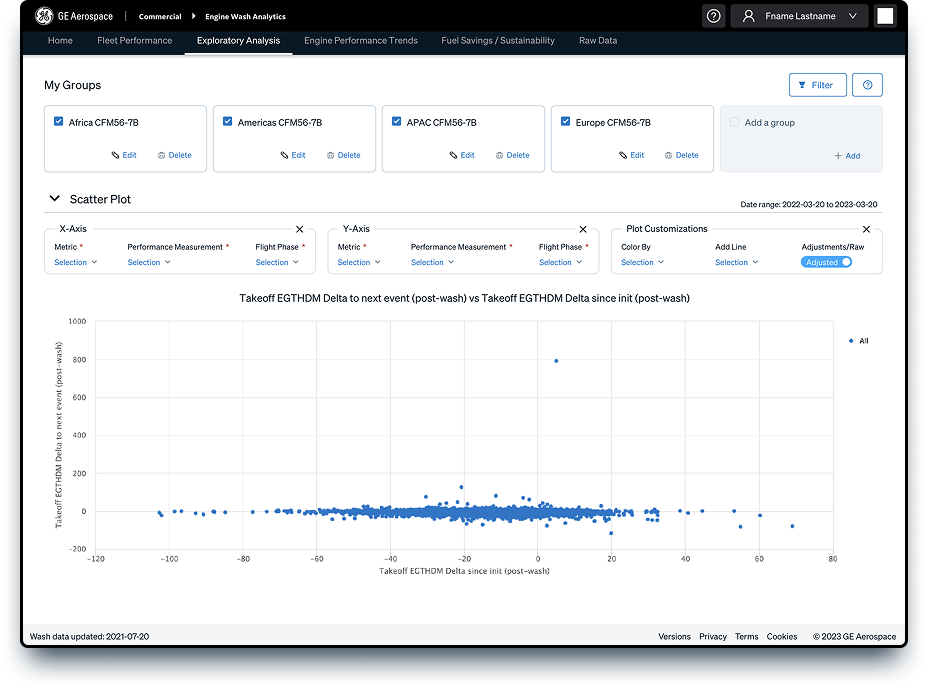
Exploratory analysis page
The Exploratory Analysis page allows an in-depth look at individual wash event data through two free-form plotting windows. Selected group or filtered data is plotted, with a default date range set to view all historical data available. Filters can be applied to reduce the date range of plotted data, and plots can be used to investigate wash-related trends or insights within a data set.
Key learnings
- Enhanced cross-cultural communication skills, and improved scheduling and conducting productive meetings across multiple time zones.
- Deepened industry knowledge — gaining insight into the specific needs and challenges of different aviation industry stakeholders, and acquiring aviation-specific terminology and concepts.
- Improved skills in managing version control and maintaining consistency across design files.
- Improved skills in managing sprints and iterative design processes using agile methodologies.
- Enhanced understanding of international design standards and regulatory compliance in aviation.